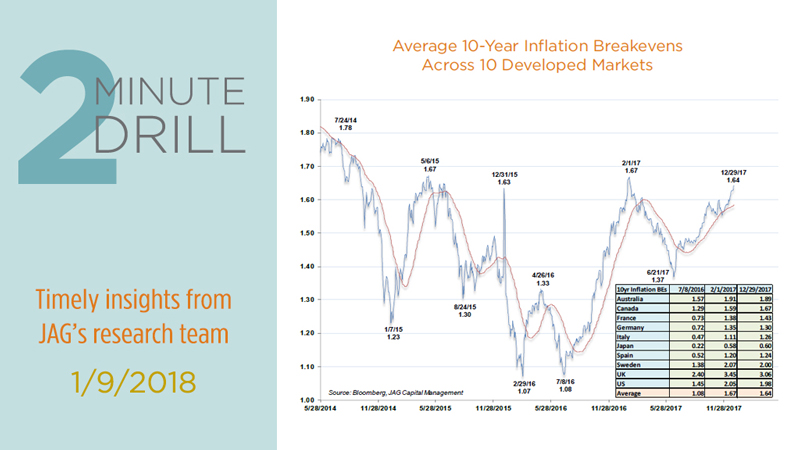
Although this is not getting much coverage (yet), inflation expectations are rising globally. Although financial markets only expect prices to rise a modest 1.64% per year over the coming decade, it is worth noting that we are very close to seeing these expectations break out to multi-year highs for the developed markets. Drivers include burgeoning commodity prices (especially in industrial metals and oil), strengthening global economic growth, and whiffs of wage inflation. For a variety of reasons, we do not expect inflation to rocket above 3% anytime soon. But at the margin, a continued increase in inflation expectations would make us more bullish on Treasury Inflation-Protected Securities (TIPS), as well as selected commodity-oriented stocks in the Materials sector.

The S&P returned 21.83% in 2017 (including dividends), leading many to wonder if this bull market has gotten ahead of itself. To help explore this question, we use this chart to plot the S&P 500’s inflation-adjusted total return since 1926. Note that the index (blue line) tends to oscillate around a long-term trendline (plotted in red) that rises at a constant rate of 6.9% per year. We can clearly see the massive market tops that occurred in 1929, 1966, and 2000. Similarly, we can use this chart to identify the generational buying opportunities of 1942, 1982, and 2009. As powerful as the bull market has been over the past eight years, stocks are only just now crossing back over the long-term trendline – even after a truly great year in 2017. Historically, these sorts of positive trendline cross-overs have tended to be followed by further gains, especially when they have been preceded by multi-year declines. In terms of both time and price, we see room for further upside in equities.
