We have previously detailed some potentially bullish fundamental and technical data that makes us believe the odds favor a decent year for stocks in 2019 (see A Bullish (and Rare) Signal for Stocks in 2019 and The (Long Term) Trend Is Your Friend.


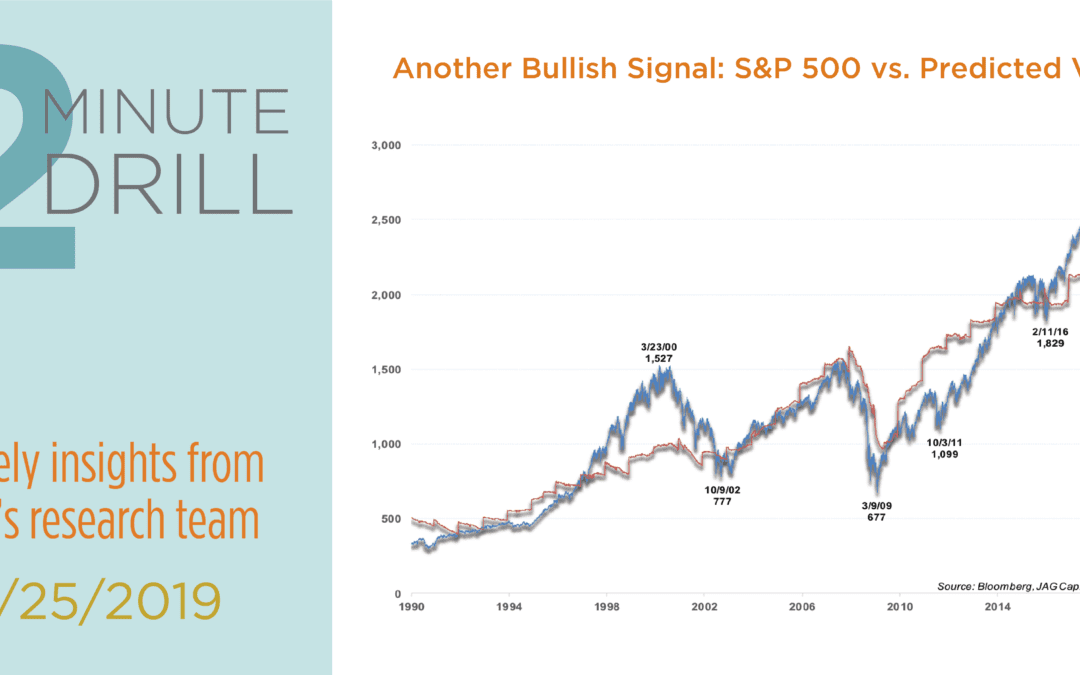
The charts above point out yet another positive observation. By performing a simple regression, we can determine a “predicted value” for the S&P 500 and compare it to the actual level of the index. What jumps out at us is the fact that the recent correction has knocked the S&P 500 down below its predicted value. In fact, on January 3, the index had fallen more than 12% below its predicted value, the lowest such reading since 2013. We caution that this is far from a perfect timing signal, as the index has spent multi-year periods trading well above the predicted levels indicated by the regression (i.e. the late ‘90’s, and 2015-2017). Similarly, investing in early 2008 – when the S&P dipped below its predicted value – would have been an extremely painful entry point. That said, outside of recessions, this indicator has flagged important market bottoms reasonably well. January ’95, March ’03, late ’08, and October ’11 are examples of instances which proved to be attractive entry points for stock investors. We are cautiously optimistic that we could currently be in the midst of yet another positive investment backdrop for longer-term investors.