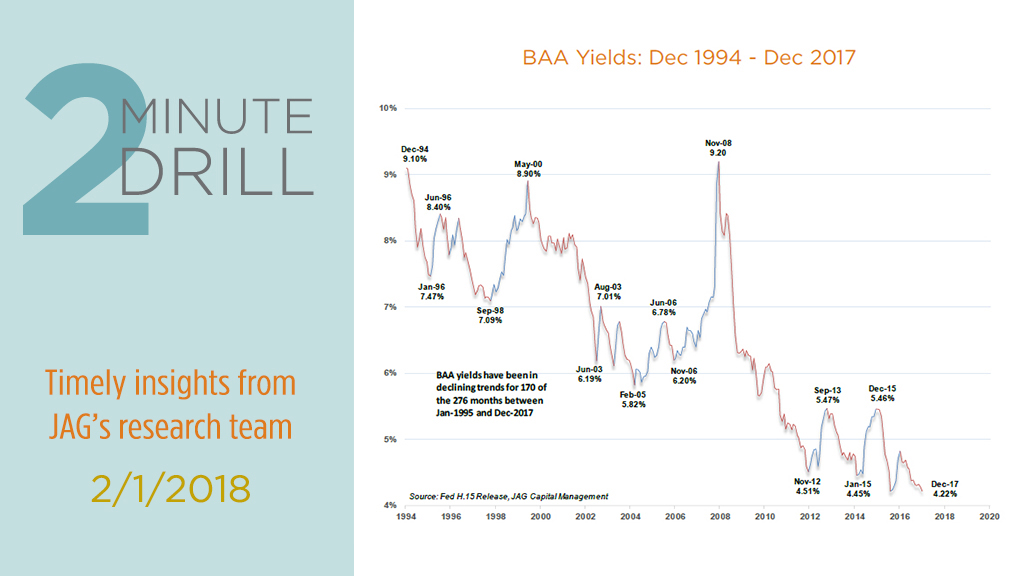
Moody’s BAA rating for corporate bonds is roughly equivalent to S&P’s BBB rating. Bonds with this rating are considered “investment grade,” albeit at the low end of the investment grade range. Since they are neither ultra-high quality (i.e. U.S. Treasuries, or Aaa/AAA rated corporate bonds), or junk (i.e. below investment grade), these types of bonds can provide some valuable insights into investors’ baseline risk appetite. Note that since 1994 BAA yields have been generally declining, save for periodic bouts of risk-aversion (including the “grand daddy” of all risk-off periods that occurred in 2008). Although Treasury yields been rising since 2016, BAA yields have declined over the same period. This is probably due to investors’ perceptions that recession risks are modest, which have caused yield spreads to compress to multi-year lows.

With 10-year Treasury yields now inching closer to the psychologically-important 3% level (2.726% as of this writing), it is possible that the long-term trend for interest rates may be changing. Some pundits believe that there will be upward pressure on bond yields as the global economy continues to accelerate and inflationary pressures build. Assuming these “bond bears” are correct, what are the implications for stocks? This graph may provide some clues. Here we compare the stock performance of more high- and low-debt companies during periods of rising and declining BAA yields. Note that stocks tend to better overall when yields are declining (red bars). However, when BAA yields are on the rise, investors clearly prefer companies with less debt on their balance sheets. In fact, the least-indebted companies outperformed the most heavily-indebted companies by almost 1000 basis points during periods when BAA yields were rising.
