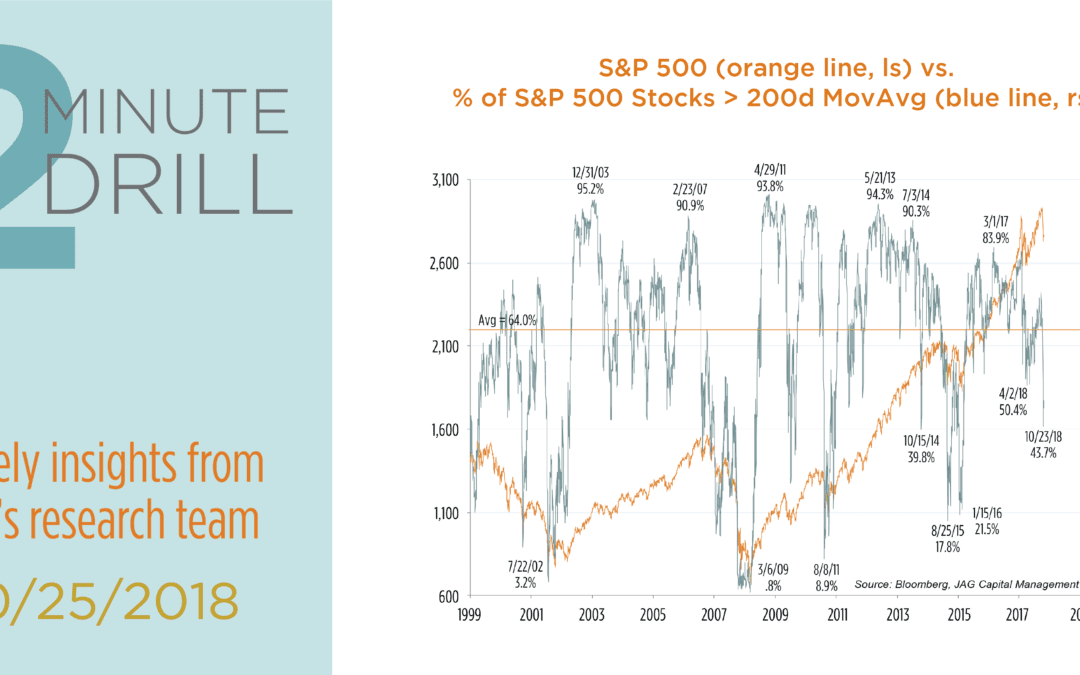
There is an old saying that describes market behavior: “Stair-steps up, elevators down.” In other words, when stocks are rising, they tend to do so in a slow and steady manner. But declines and corrections tend to be much sharper and swifter. So far, October 2018 is turning into Exhibit A for this dictum. The S&P 500 is now almost 7% off its September high’s. According to Bespoke, more than 17% of S&P 500 stocks traded at new 52-week low’s on October 24, the highest percentage since February 2016. Similarly, as our chart shows, less than 44% of S&P 500 members are trading above their 200-day moving averages. By this metric, the current pullback is more painful than the one we experienced earlier this year, and is the worst since early 2016. Outside of major bear market bottoms like 2002 and 2009, the current levels tend to be supportive of market recoveries. Our takeaway: we think the market could be preparing to build a shortto intermediate-term base as we finish out 2018.

As this chart shows, stocks tend to establish trade-able bottoms when they have reached deeply oversold conditions. Earlier this month, our Overbought/Oversold indicator reached relatively extreme levels. Although it has since recovered somewhat, we think this indicator supports our sense that fear levels have risen enough to support a short/intermediate recovery within the next few weeks. From a fundamental perspective, corporate earnings remain robust, and valuations are less demanding than they were a few short weeks ago. This alignment between fundamental and technical factors – both of which tilt in the bullish direction – make us incrementally more optimistic that the current pullback is a shorter-term phenomenon rather than the start of a longer bear market phase. As always, time will tell.
