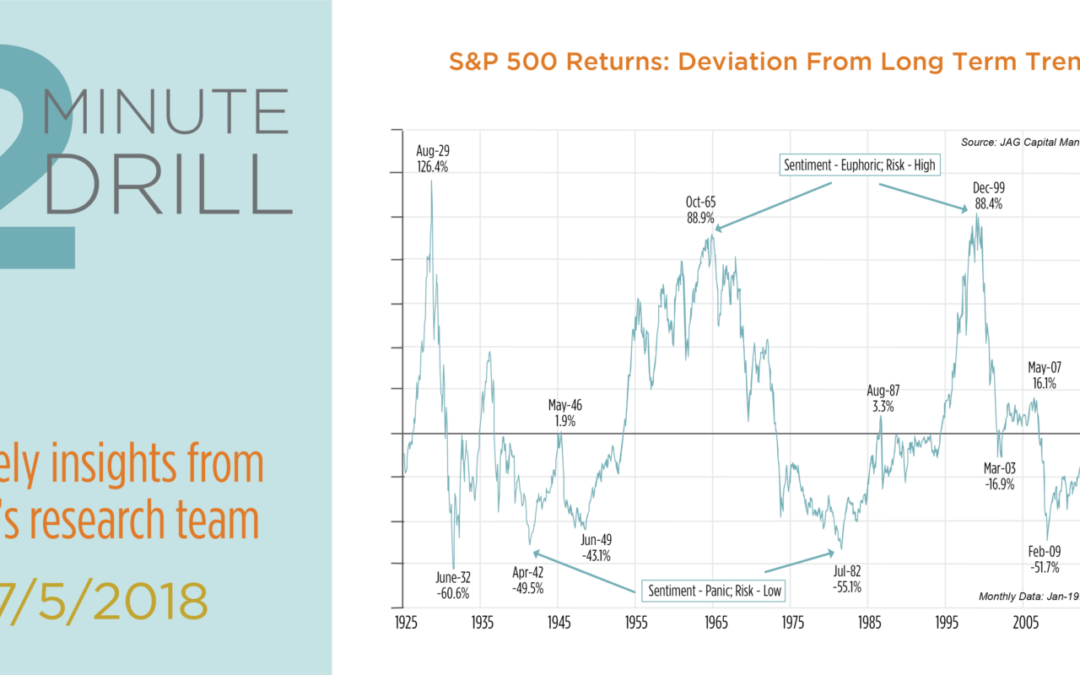
Over the last several years, we haven’t had to look too hard to find lots of pundits telling us how “over-extended” the current bull market is. But when we compare the inflation-adjusted S&P 500 and its long-term trend since 1926, the picture becomes different (and clearer). There have been three true equity market “bubbles” in the past 93 years: the 1929 mania, the Nifty 50’s in the 1960’s, and the dot.com craziness in the late ’90’s (Remember that the 2008 Great Financial Crisis was a global liquidity collapse in the financial markets, rather than the popping of a classic bubble in stocks). Note that each of these three events occurred when the S&P 500 was trading more than 80% higher than its long-term inflation-adjusted trend line. The current reading shows that the market is only 4.3% above this trendline. Does this mean we can be certain that we are not on the precipice of a bear market or a big correction? No! In the short term, markets can do whatever they want to do, whenever they want to do it. However, we can say with a high degree of confidence that the stock market is not showing the signs of euphoria that it showed at past bull market “bubble” tops.
From a relative valuation perspective, stocks are no longer as cheap as they were during the summer of 2011, but they continue to be attractively valued compared to bonds. This chart compares the S&P 500’s forward earnings yield to BAA-rated bond yields. The S&P’s 5.9% forward earnings yield is 1% higher than BAA-rated bonds yielding an average of 4.85%. This implies that stocks remain reasonably valued when compared to corporate bonds. Of course, this measure assumes that corporate earnings continue to be strong, which is far from a guarantee. But it also refutes the commonly-cited narrative that stock valuations are historically high. If earnings continue to be reasonably robust over the next year, and bond yields do not spike significantly from here, we think there is valuation support for higher stock prices over the intermediate term.
 From a relative valuation perspective, stocks are no longer as cheap as they were during the summer of 2011, but they continue to be attractively valued compared to bonds. This chart compares the S&P 500’s forward earnings yield to BAA-rated bond yields. The S&P’s 5.9% forward earnings yield is 1% higher than BAA-rated bonds yielding an average of 4.85%. This implies that stocks remain reasonably valued when compared to corporate bonds. Of course, this measure assumes that corporate earnings continue to be strong, which is far from a guarantee. But it also refutes the commonly-cited narrative that stock valuations are historically high. If earnings continue to be reasonably robust over the next year, and bond yields do not spike significantly from here, we think there is valuation support for higher stock prices over the intermediate term.