As most investors are aware, the stock market had quite a rough go in the 4th quarter 2018. From the 9/20/18 peak through the close of trading on 12/24/18, the S&P 500 fell by 19.8%, thereby falling just short of the traditional -20% decline that characterizes bear markets. Since then, stocks have staged an impressive rally of more than 10%. The trillion-dollar question remains: where does the market go from here?

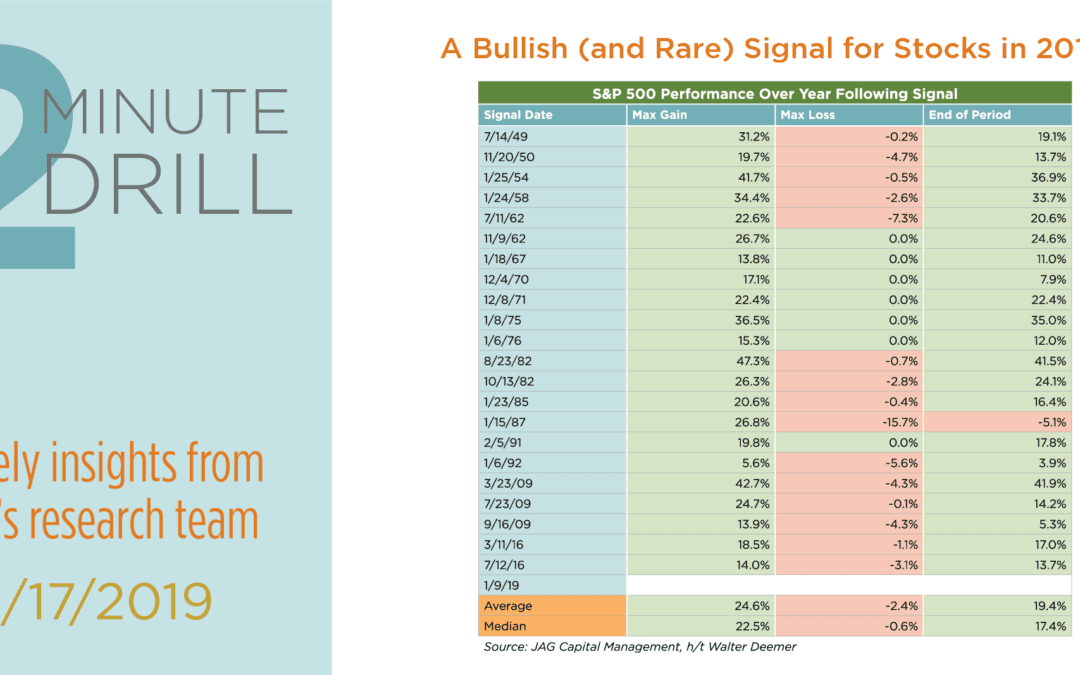
No one can know for certain, but an important technical signal was generated on 1/9/19 that potentially provides some clues. Originally identified by equity strategist Walter Deemer in the 1970’s, the signal is called Breakaway Breadth Thrust. This occurs when the number of ten-day total advancers on the New York Stock Exchange (NYSE) are greater than 1.97 times the ten-day total NYSE decliners. This condition has only occurred 23 times since World War 2. Importantly for our purposes, Breakaway Breadth Thrust has historically tended to occur at the beginning of cyclical bull markets. As the table above demonstrates, in the 22 observations prior to the current one, the S&P 500 has produced an average gain of 19.4% (median 17.4%) in the subsequent 12-month period. In fact, the signal has been followed by forward 1-year stock market declines in one instance – the early 1987 trigger that had the misfortune to occur roughly nine months prior to the October ’87 crash. We entered the year with the belief that the fundamentals favor better returns for stocks in 2019. In our opinion, the late-2018 correction made stock valuations more reasonable, corporate earnings outlooks remain solid, and the odds of a 2019 recession are low. Markets never offer any guarantees, but the fact that we now have technical confirmation of our fundamental appraisal of the market makes us incrementally more bullish on stocks in the New Year.