Stocks roared into the New Year, with the S&P 500 delivering a 6.64% return in the fourth quarter of 2017. For the full year, the benchmark index returned 21.83% (both figures include the effect of dividends). It is worth noting how surprising last year’s stock market performance was to most of the cognoscenti on Wall Street. When the Barron’s 2017 Analyst Forecast was published on 12/19/16, the strategists’ average prediction called for only a 5.4% yearly gain for the S&P 500.
While they correctly predicted the general direction of stock prices (up), they did not come close to foreseeing the magnitude of gains experienced by the broad equity market. We are not pointing this fact out to malign investment gurus. They are almost uniformly intelligent, dedicated, and hard-working professionals. However, they have all experienced similar education and training, and they tend to rely upon almost identical datasets to inform their forecasts. Consequently, their market prognostications tend to be tightly grouped with each other. Since their consensus expectations are largely derived from widely-known information that is already discounted by the markets, their predictions tend to be wrong more often than not. Always remember that surprises are a feature of financial markets, not a bug!
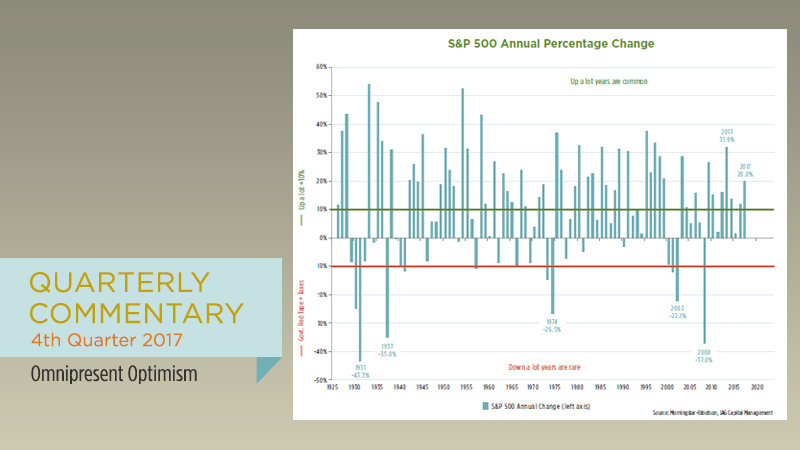
Looking forward to 2018, we start with some baseline assumptions. Although some of our colleagues in the investment industry seem to enjoy making investing maximally complicating, there are only four general paths the stock market can take in any single year. To paraphrase legendary investor Ken Fisher, market outcomes can be divided into four categories: 1. stocks can be up a lot (10%+); 2. up a little (between 0% and 10%); 3. down a little (between 0% and -10%), or 4. down a lot (fall by more than 10%). Thankfully for long-term investors, “up a lot” years are relatively common. In fact, the S&P 500 experienced 10%+ gains in 52 of the last 91 calendar years, including 2017.