March 18, 2022 —
Summary
The current investment backdrop is reminiscent of the old Chinese curse, “May you live in interesting times.” Between inflation at 40-year highs, a hawkish Fed, a horrific war in Ukraine, a sharp correction in many growth stocks, and news of a COVID-19 surge in China, there is a veritable hailstorm of bad news rolling through the markets. At some point, most of these headwinds will be priced in. One way to identify potential inflection points is to examine investor sentiment. A metric JAG uses to gauge sentiment fell to an oversold extreme on 3/11. Similar readings in the past have preceded upside reversals in stock prices.
Wouldn’t it be wonderful if there was a reliable method for determining when the stock market was about to change direction in a broad and meaningful way? Whether the directional change would be a move lower after an uptrend or a move higher following a drop, getting a heads up on a potential reversal would be the holy grail of financial forecasting. Unfortunately, despite centuries of diligent effort, accurately forecasting where markets might be headed next remains an unfulfilled dream.
While we don’t have a way of precisely forecasting market moves, we don’t have to operate completely in the dark either. There are indicators that do provide clues about how a given market might behave going forward. Metrics that track investor sentiment are an example of a widely used tool to help identify a possible change in trend.
Sentiment indicators attempt to measure the mood of investors whether they are hopeful, optimistic, or even euphoric vs. fearful, pessimistic, or despondent. It has been observed that extremes in mood whether it be euphoria or despair are often associated with a reversal in the prevailing trend of the market involved.
To capitalize on this potentially valuable information in the equity market, JAG has constructed an indicator that combines data from Investors Intelligence, the American Association of Individual Investors (AAII), and Market Vane. Each of these services gathers information from different groups of market participants. The Investors Intelligence service distills recommendations from over 100 independent investment newsletters and reports the percentage that they deem are bullish, bearish or in the correction camp. The AAII data is based on responses provided by members to an online survey. Market Vane provides a number they call the Bullish Consensus that gauges the mood of futures traders.
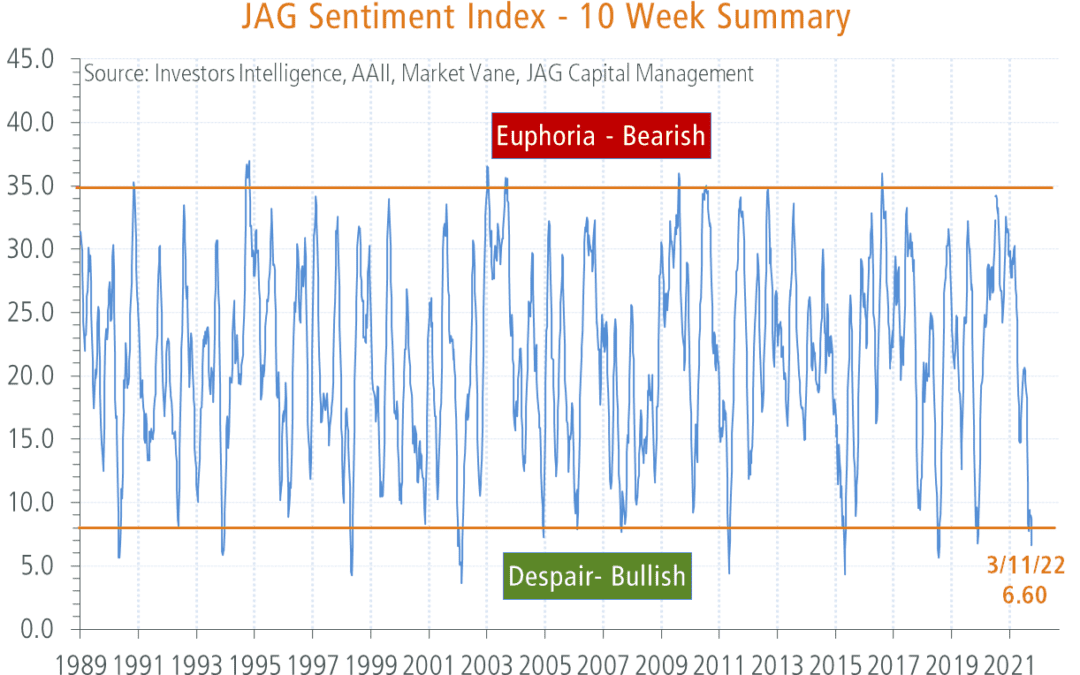
JAG collects and combines data from these three sources on a weekly basis to calculate the JAG Sentiment Index. The result is a data series that oscillates between lows in the single digits to highs in the 35-40 range as shown in Chart 1. As is the case with nearly all indicators interpreting the chart requires a certain amount of judgement. However, we do have a general rule that presumes high readings, those above 30, indicate excessive optimism that could lead to stocks reversing lower. Conversely readings less than 10 indicate an elevated level of fear that sometimes precedes a low in price. We’ve observed that low readings tend to be a more reliable sign of a move higher than high readings are of a move lower. The important point is: the extreme readings often have the most potential value.
Table 1: JAG Sentiment Indicator
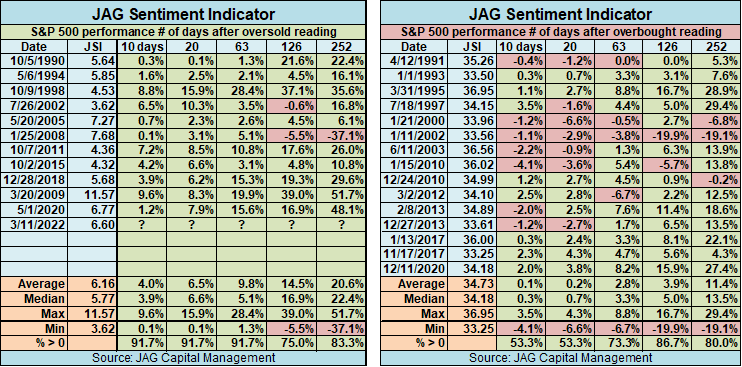
With that in mind we’d like to highlight the low reading of 6.60 the JAG Sentiment Index (JSI) recorded on 3/11/2022. This reading is in a range that has been associated with market lows of varying significance in the past. In Table 1 we show how the S&P 500 has performed over various intervals following low and high JSI readings. As the table shows, on average stocks have tended to perform better following low readings vs. high readings. Based on this evidence we think stocks could experience a respite from the recent selling pressure they have endured.
While the JSI is not the holy grail, we do think it provides helpful clues about potential inflection points in stock market trends. We’ll be watching closely to see if the latest low JSI reading does mark a turn higher in stock prices.
JAG’s investment approach helps us identify great companies that can capitalize on durable sector and industry-specific trends and opportunities. We welcome your comments and questions any time!
– Mike Buck , CFA®, JAG Investment Team